
Serving Up Media the Right Way to the Right People
Services
Consumer Insights
Data & Analytics
Thought Leadership
|October 2, 2023
Search habits vary across audiences and platforms. No two platforms are alike and when choosing to advertise on one, making sure the right one is the key to success.
We chose to explore those search habits among various age groups in 14 categories in our proprietary research to uncover consumer search behaviors. As we delve into our proprietary research, we’ll uncover how different age groups’ preferences and behaviors shape their restaurant search habits.
In the realm of search, Google reigns supreme for both the 18-34 and 35+ age groups. However, those in the 35+ age group favor Google a staggering 165% more than their younger counterparts when considering it their go-to platform for inspiration and information.
The 18-34 age group represents a tech-savvy and socially engaged demographic. It comes as no surprise that social media, notably TikTok and Instagram, feature prominently among their preferred platforms when searching for restaurants. These individuals gravitate towards platforms offering fast-paced engagement, including Google, Facebook, Instagram, TikTok, and Twitter.
In contrast, older individuals (35+) favor the familiarity of Google, Facebook, YouTube, and Instagram. This cohort exhibits a distinct set of platform preferences, favoring more traditional and widely recognized search engines. Their preference aligns with well-established sources that have stood the test of time.
The data is a part of a broader dataset.
Key Takeaways
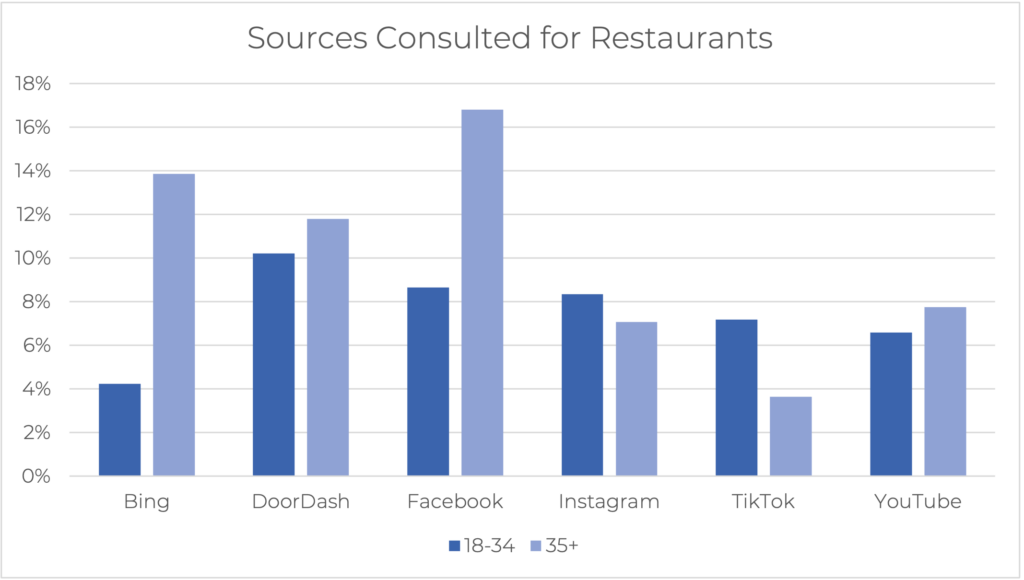
- Visual platforms are among the top sources consulted for Restaurants. 3/6 top sources for each age group are social media platforms heavily reliant on visuals, such as YouTube and Instagram. This highlights the significance of visual content in the restaurant discovery process.
- Regardless of age, Facebook maintains its universal appeal emerging as a top choice among the preferred platforms for restaurant-related searches. Approximately 66% of the top overall sources for both age groups (18-34, 35+) consist of social media platforms, with Facebook taking a prominent position and being more favored by those 35+.
- Among the top 6 sources preferred by each age cohort, over 50% of them are the same. The exceptions are Bing and TikTok. TikTok emerges as a top source for the 18-34 age group, accounting for 7% of the total, while Bing is popular among the 35+ age group, making up 14% of the total.
- Twitter, Reddit, LinkedIn, etc. all exhibit low preference among both age groups with minimal differences between them. These platforms may not be the primary choices for restaurant-related searches across generations.
- DoorDash had the 2nd highest presence among the 18-34 age group at 10%. Those 35+ use DoorDash slightly more, but also have other clear platform favorites above and beyond the delivery app.
The data demonstrates the importance of visual content and social media platforms in the restaurant discovery process. It also highlights the enduring appeal of Facebook across age groups, the generational differences in platform preferences, and the consistent low preference for certain platforms.
Tailoring marketing strategies to align with the preferred platforms of each age group can enhance engagement and ultimately lead to more effective and strong campaigns.
Related Articles

June 10, 2023
Services
Entering the Entrepreneur Economy
U.S. new business applications were already on the rise before COVID-19. The upward trend in entrepreneurship has…

June 10, 2023
Services
The Learning Stage of the Journey
The Learning Stage of the customer journey is incredibly important for consumers as they begin to shape their brain with new…

June 10, 2023
Services
Differentiation in an Ocean of Agencies
There are 66,113 businesses in advertising, PR, and related services in the U.S. You need more than the promise of great…